Class 12: Lab and HW Q13/14

Author

Jervic Aquino (PID:A17756721)

Lab Section 1 Work

Download then read the CSV file from Ensemble

data <- read.csv("373531-SampleGenotypes-Homo_sapiens_Variation_Sample_rs8067378.csv")
head(data)
  Sample..Male.Female.Unknown. Genotype..forward.strand. Population.s. Father
1                  NA19648 (F)                       A|A ALL, AMR, MXL      -
2                  NA19649 (M)                       G|G ALL, AMR, MXL      -
3                  NA19651 (F)                       A|A ALL, AMR, MXL      -
4                  NA19652 (M)                       G|G ALL, AMR, MXL      -
5                  NA19654 (F)                       G|G ALL, AMR, MXL      -
6                  NA19655 (M)                       A|G ALL, AMR, MXL      -
  Mother
1      -
2      -
3      -
4      -
5      -
6      -
table(data$Genotype..forward.strand.)

A|A A|G G|A G|G 
 22  21  12   9 
table(data$Genotype..forward.strand.) / nrow(data)

     A|A      A|G      G|A      G|G 
0.343750 0.328125 0.187500 0.140625 

Section 4 HW

How many samples do we have ?

expr <- read.table("rs8067378_ENSG00000172057.6.txt")
head(expr)
   sample geno      exp
1 HG00367  A/G 28.96038
2 NA20768  A/G 20.24449
3 HG00361  A/A 31.32628
4 HG00135  A/A 34.11169
5 NA18870  G/G 18.25141
6 NA11993  A/A 32.89721
nrow(expr)
[1] 462

Q13. Read this file into R and determine the sample size for each genotype and their corresponding median expression levels for each of these genotypes

  • Sample size:
table(expr$geno)

A/A A/G G/G 
108 233 121 
median <- boxplot(exp ~ geno, expr)

print(median)
$stats
         [,1]     [,2]     [,3]
[1,] 15.42908  7.07505  6.67482
[2,] 26.95022 20.62572 16.90256
[3,] 31.24847 25.06486 20.07363
[4,] 35.95503 30.55183 24.45672
[5,] 49.39612 42.75662 33.95602

$n
[1] 108 233 121

$conf
         [,1]     [,2]     [,3]
[1,] 29.87942 24.03742 18.98858
[2,] 32.61753 26.09230 21.15868

$out
[1] 51.51787 50.16704 51.30170 11.39643 48.03410

$group
[1] 1 1 1 1 2

$names
[1] "A/A" "A/G" "G/G"
  • Corresponding median expression levels:
print(paste(median$names, median$stats[3,]))
[1] "A/A 31.248475" "A/G 25.06486"  "G/G 20.07363" 

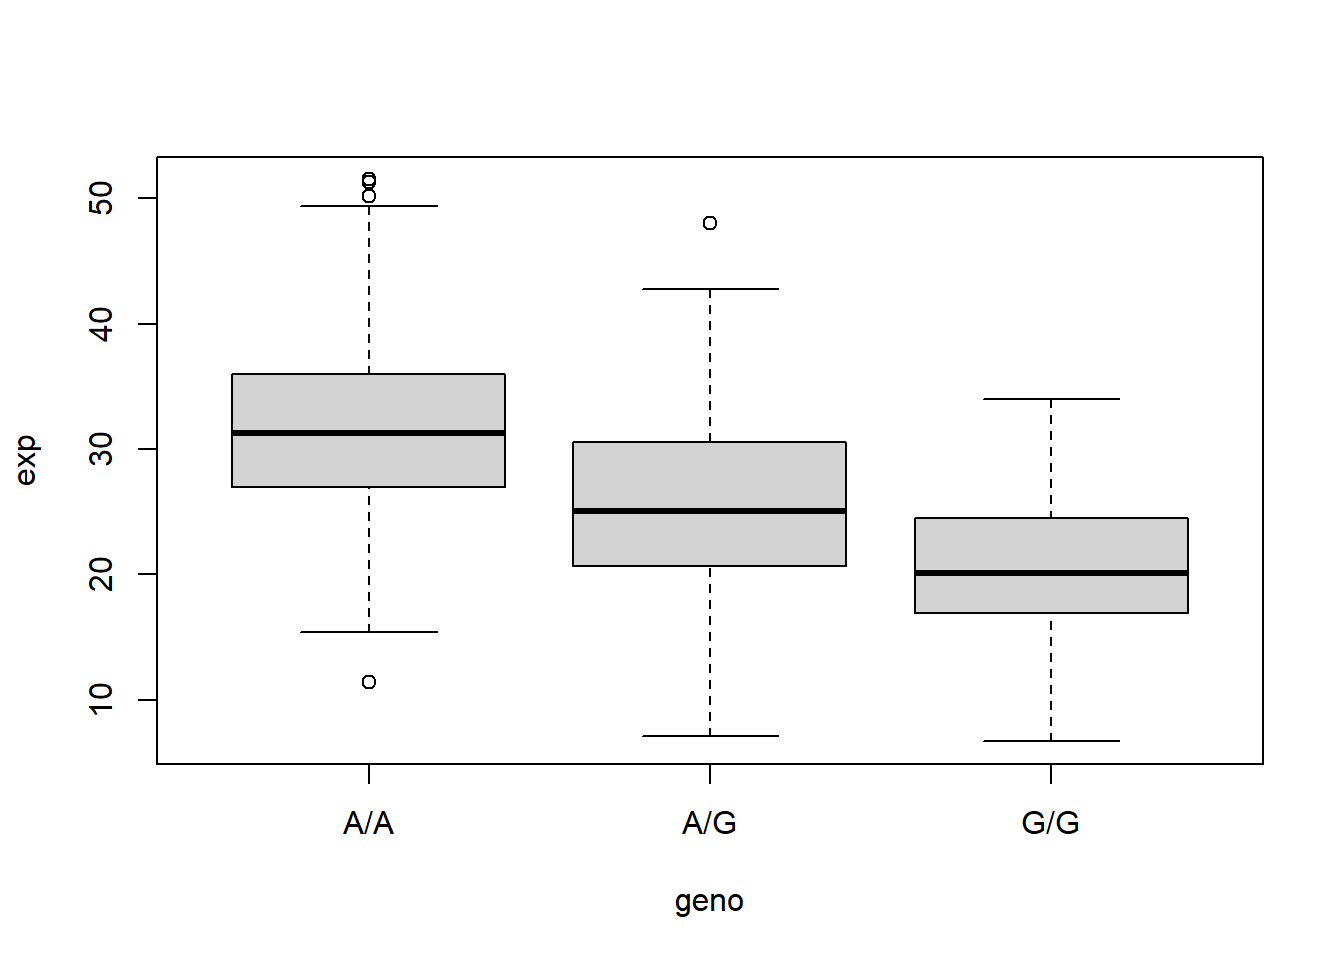
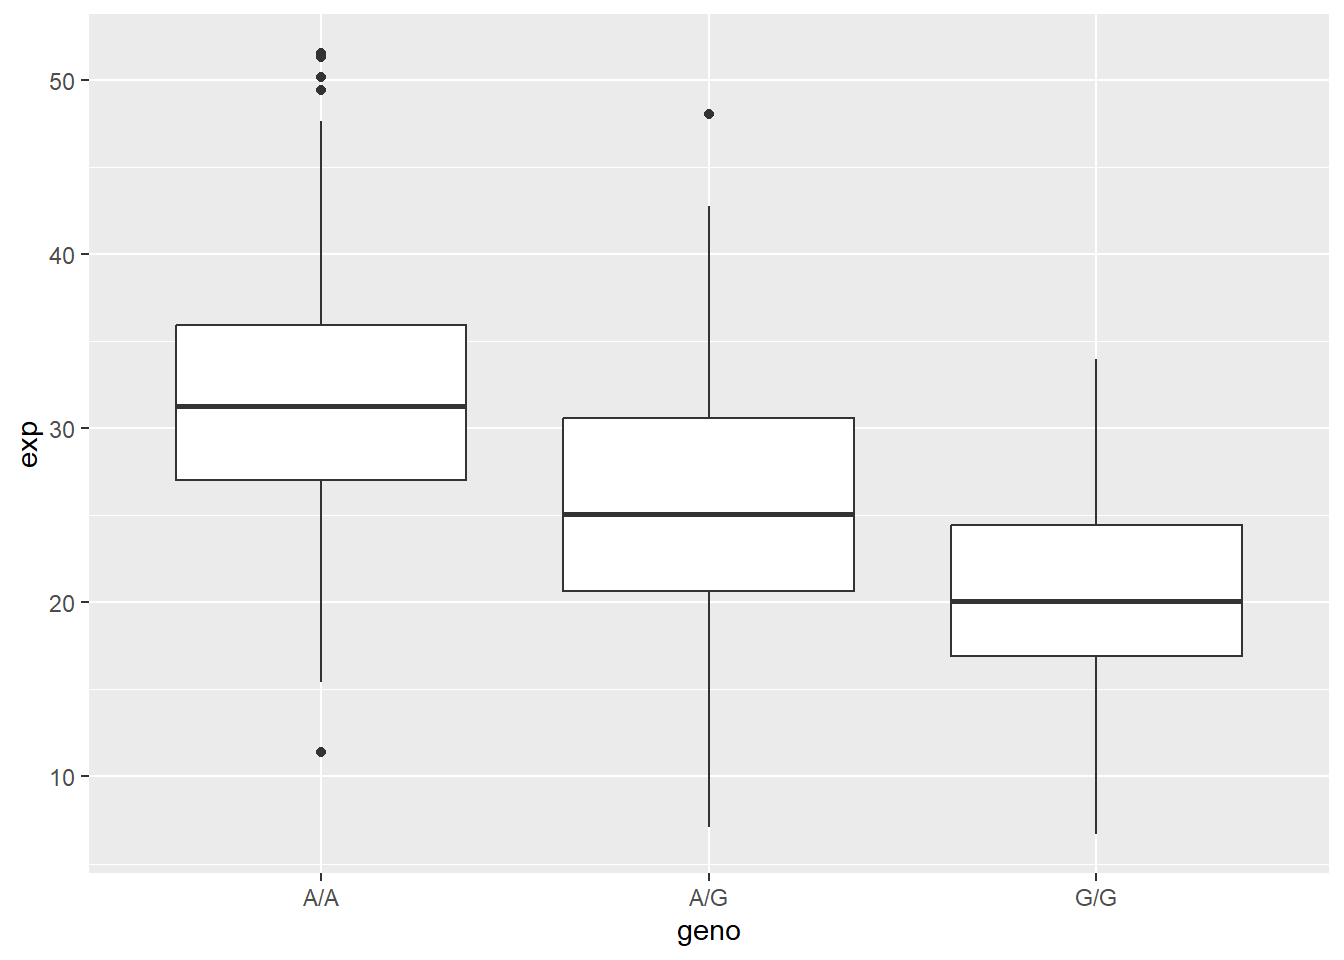
Q14: Generate a boxplot with a box per genotype, what could you infer from the relative expression value between A/A and G/G displayed in this plot? Does the SNP effect the expression of ORMDL3?

library(ggplot2)

ggplot(expr) + 
  aes(x=geno, y=exp) + 
  geom_boxplot()

  • It can inferred that the A/A genotype causes higher levels of expression than the G/G genotype. The SNP effect does effect the expression of ORMDL3, in which ORMDL3 has an expression level in between A/A and G/G. This may be because having an A allows for expression higher than G/G but being accompanied by G results in expression less than A/A.